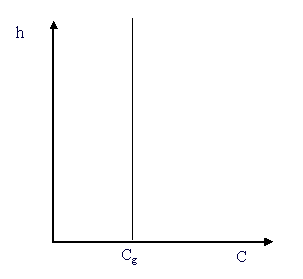
Figure 1 - Constant Sound Speed Profile in a Homogeneous Atmosphere
Current methods for analysing the acoustic performance of barriers assume a homogeneous atmosphere. In other words the acoustic medium is still (no wind) and of uniform temperature. Thus the value of the speed of sound does not vary with location or time. This constant sound speed profile is depicted in Figure 1 below,

Figure 1 - Constant Sound Speed Profile in a Homogeneous Atmosphere
In the presence of such a sound speed profile, the acoustic rays emitted from a source are
straight. The class of methods that model the spreading of sound in terms of rays are
called geometric models. For a barrier in between a source and receiver, 4 rays appear as
shown in the Figure 2:
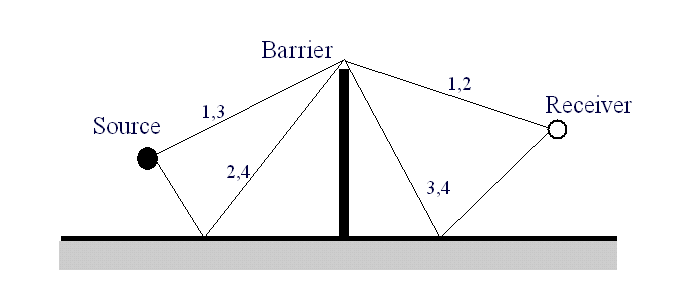
Figure 2 - Possible Ray Paths in Homogeneous Atmosphere
Such geometric methods are simple and efficient as compared to the more complex wave-based methods, as they involve simple geometric calculations. As such, the insertion loss of a barrier (the difference in sound levels with and without the barrier) can be determined for a large field of receivers in reasonable calculation times. The following picture (Figure 3) shows contours of insertion losses (hot colors -> low insertion loss (high sound levels); cool colors -> high insertion losses (low sound levels)). Note that in assuming homogeneous conditions, high insertion losses are observed at large distances away from the barrier. This is rarely the case in actuality. It should be noted that the IL calculations shown here between the source and the barrier, do not include the effects of sound reflected from the barrier.

Figure 3: Insertion Loss Contours in a Homogeneous Atmosphere
Figure 4, below, shows the insertion loss values along a line of receivers 1.5 m high. The source is 10 m away from the barrier and 0.5 m above ground. The barrier is 3 m high. Note the good insertion losses predicted at large distances from the barrier.

Figure 4: Insertion Loss vs. Distance Behind Barrier in a Homogeneous Atmosphere
Such geometric methods are simple and efficient as compared to the more complex wave-based methods. A paper by Muradali A. and Fyfe, K.R., "A Study of 2D and 3D Barrier Insertion Loss" (listed in detail below) discusses and compares the geometric methods with the wave-based methods.
The insertion losses predicted in the previous figure are rarely equaled in real world applications. This is mainly due to the uniform acoustic medium assumption. In actuality the atmosphere consists of wind and temperature gradients, which not only vary with location, but also with time (atmospheric turbulence). Such inhomogeneities greatly affect the way in which sound energy is transmitted.
There are several techniques for modeling the propagation of sound in a medium with inhomogeneous qualities. These include the Fast Field Program (FFP) and the Parabolic Equation (PE) formulations. Such wave based techniques are computationally intensive and are impractical tools for noise barrier design and evaluation.
More recently a geometric model was formulated for modeling sound propagation in non-uniform mediums. The model assumes that the sound speed of the acoustic medium varies linearly with height (see Figure 5), which results in sound rays that are curved.
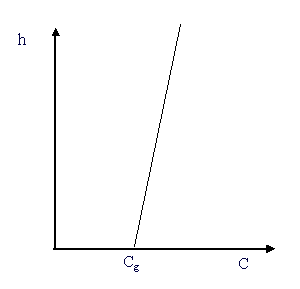
Figure 5: Linear Sound Speed Gradient
The downward refracting sound speed profile, shown above, is of great concern for noise
barrier evaluation (commonly occuring at nighttime when the ground is cooler than the air
above it). This is because in such conditions sound rays curve back down towards the
ground (hence the term downward refracting). This has the adverse effect of keeping most
of the sound energy emmitted from the source near the ground and also, as shown in Figure
6, the sound rays curve over top the barrier reducing the shielding effect.
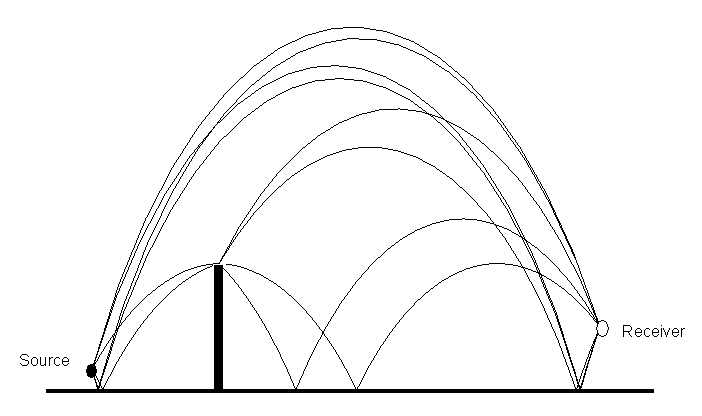
Figure 6: Possible Ray Paths from Source to Receiver in a Linear Speed Gradient
The following contour plot shows the insertion losses evaluated for a single linear sound speed profile.

Figure 7: Insertion Loss Contours in Linear Gradient Atmospheric Modeling
Note that the insertion losses at locations far away from the barrier are no longer shown to be unrealistically high. Only the region immediately behind the barrier is shown to be shielded.
The following figure (Figure 8) shows the insertion loss for the same source-barrier-receiver line geometry as Figure 7. Note that the insertion losses change rapidly as the receiver moves farther away from the barrier. This is because of the appearance and disappearance of rays as predicted by the geometric model. The contributions from these rays sharply increase/decrease sound pressures.

Figure 8: Insertion Loss vs. Distance Behind Barrier in Linear Gradient Atmospheric
Modeling
As mentioned earlier, the atmospheric inhomogeneities not only vary with location but also with time (atmospheric turbulence). To capture the effects of such conditions, barrier calculations are averaged over a range of sound speed profiles. The profiles, shown below in Figure 9, range from moderate conditions (weak gradient) to strong downward refracting conditions (strong gradient).
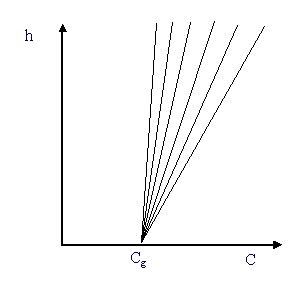
Figure 9: Several Linear Sound Speed Gradients
The IL contours are shown below in Figure 10, for a turbulent atmosphere.

Figure 10: Insertion Loss Contours in Turbulent Atmospheric Modeling
The following figure shows insertions losses averaged over a range of sound speed profiles for the same source-barrier-receiver line geometry as before. The expected degradation due to atmospheric turbulence is observed.

Figure 11: Insertion Loss vs. Distance Behind Barrier in Turbulent Atmospheric Modeling
Oorspronkelijke locatie: http://www.mece.ualberta.ca/staff/fyfe/RoadNoise/BarrierModeling.html
Zie ook: http://www.mece.ualberta.ca/staff/fyfe/